Today, rather than anecdotal economics and narratives of overpopulation, I offer a view of the world from the bottom up. Based on 2019 UN population data, I offer a ninety year window of annual births and those of childbearing age globally, regionally, and for some selected countries. Gauging the size and changing nature of the "pie" is a question business owners, economists, and even presidents should know. How many potential customers / consumers / workers presently exist and how will this be changing going forward? Based on this, business' and nations could make informed decisions on spending, leverage, and growth. So, without further wasted digital ink, I will show that annual births have peaked in each world region (except Africa), and subsequently when the female childbearing population peaked or will peak.
Global Childbearing Females, Births
From 1950 to 1989, annual births rose by almost 1.5 million a year. Since 1989, global births have essentially stalled at around 135+/- million births a year (black columns below), while the growth of the potential quantity of females of childbearing age (red line) has slowed.
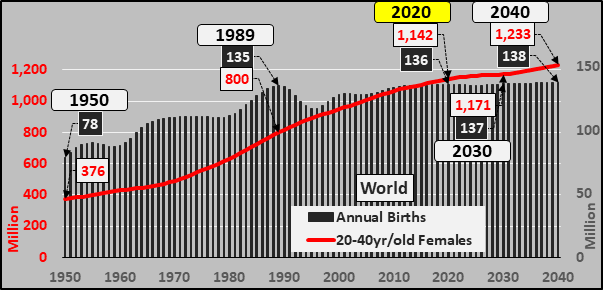 1950-1989
 +424 million, +111% 20-40yr/old females…Annual Births +57 million, +73%
1989-2020 +342 million, +40% females…Annual Births +0 million, +0%
2020-2030 +28 million, +2.5% females...Annual Births +0.5 million, +0.3%
2030-2040 +62 million, +5.3% females…Annual Births +1.4 million, +1%
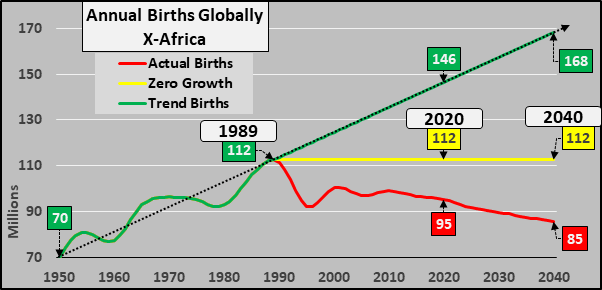
Global Births, Excluding Africa
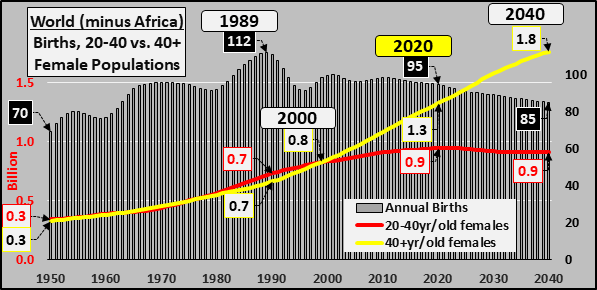
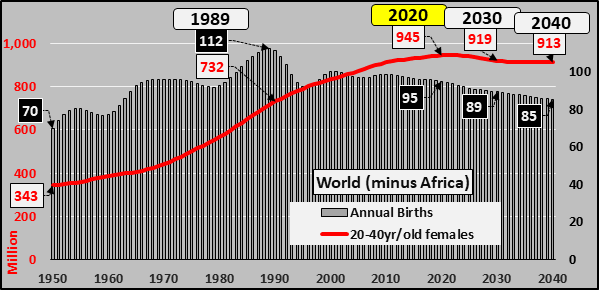
But if we exclude Africa, a radically different picture emerges. Why exclude Africa? Africa is incredibly poor, consumes just 3% of global energy/exports, and has very low levels of emigration. Essentially, what happens in Africa stays in Africa. From 1950 through 1989, global births (x-Africa) rose from 70 million births annually to 112 million annually. But 1989 was not only the beginning of a deceleration in births, it represented a hard pivot for mankind from growth to decline. Had births (x-Africa) continued to rise at the pre-1989 rate, annual births in 2040 would have reached 168+/- million. In the 30+ years since 1989, global annual births (x-Africa) have declined by 17 million, a 15% decline. The concern of overpopulation and wildly rising consumer bases ended over thirty years ago. Mankind's footprint (x-Africa) among the folks that consume 97% of everything will be persistently smaller as this plays out.
 World Childbearing Females, Births (both X-Africa)
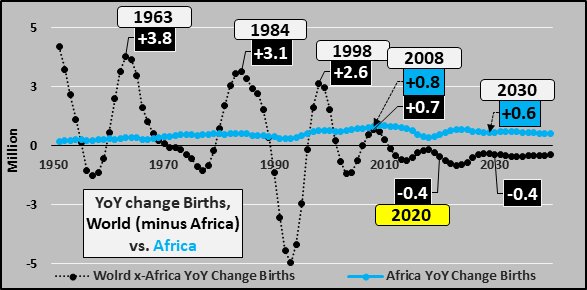
Below, focusing on annual global births (x-Africa) and the 20 to 40 year old female population. Two main points, outside of Africa, all regions either have (or in the case of Asia, soon will have) negative fertility rates and the total population of childbearing females (x-Africa) will soon begin declining. With births peaking in 1989 and declining since, the world would have to wait about thirty years until the childbearing population began declining. Queue 2020 and the decline in those capable of giving birth is just a few years from beginning. Over the next ten years, the number of females capable of childbearing will decline by about 26 million or a 3% decline. This shrinking populace plus ongoing negative fertility rates means births will begin declining at an accelerating pace. The charts below are the UN medium variants which are consistently too high...but reality will be births falling faster than projected although the exact course of that decline is simply unknowable.
 1950-1989
 +373 million, +109% females…Annual Births +43 million, +61%
1989-2020 +228 million, +32% females…Annual Births -17 million, -15%
2020-2030 -26 million, -3% females...Annual Births -5.6 million, -6%
2030-2040 -6.4 million, -1% females…Annual Births -4.2 million, -5%
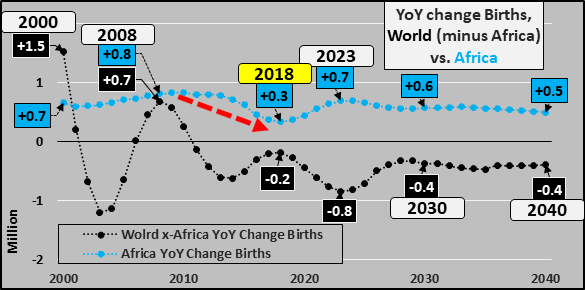
The Nexus of Inflation / Deflation
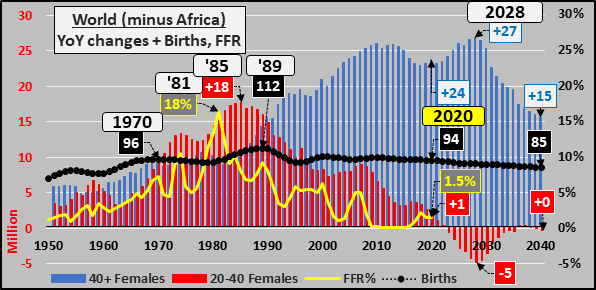
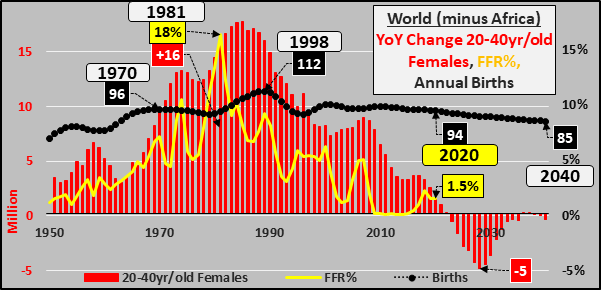
Family formation and child rearing ultimately drive spending and consumption. The chart below shows what is at the heart of global inflation; the year over year change in the female childbearing population (red columns), mirrored by the Federal Funds rate (yellow line), and the impact on annual global births (black line). The soon to be declining quantity of females of childbearing age coupled with ongoing declining fertility rates means births will continue declining...and organic demand declining...and only via destructive federal government / central bank ZIRP, NIRP, and market manipulation, can consumption and asset prices be manipulated upward.
 Regional Year of Peak Births, % Declines Since
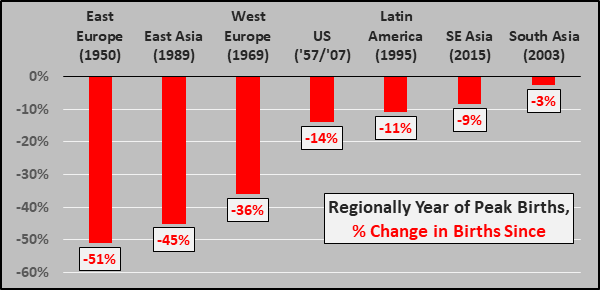
While births have declined globally, the timing and depth of the declines have varied widely. To detail this, the chart below calls out the regional year of peak births and percentage decline in births from that peak through 2020. Eastern European births peaked in 1950 (or earlier) and have declined by 51% since...East Asia peaked far later, in 1989, but has fallen far faster since with annual births down 45%. Western European births peaked in 1969 and births are down 36% since. As for the US, annual births essentially doubled peaked in 1957 and a miniscule amount higher in 2007...births are down 14% since. Latin American (South America, Central America, plus the Caribbean) births peaked in 1995 and are down 11% since. South East Asia peaked in 2015 and are already down 9%. As for India/Pakistan, etc. of South Asia, annual births peaked in 2003 and after a long plateau, have declined 3% thus far.
 East Asia Childbearing Females, Annual Births
(China, Japan, Taiwan, S/N Korea, Mongolia)
East Asia Childbearing Females, Annual Births
(China, Japan, Taiwan, S/N Korea, Mongolia)
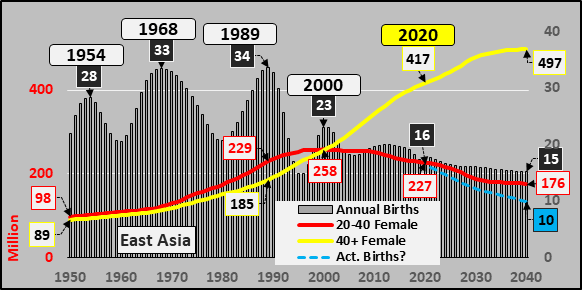
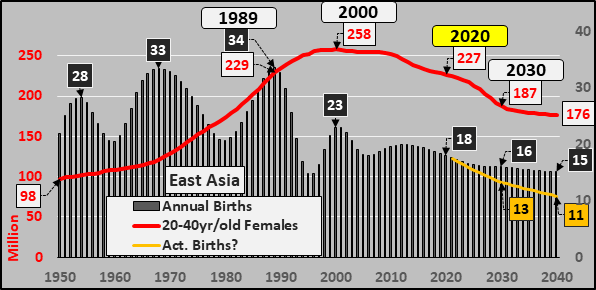
The 45% decline in East Asian births since 1989 has changed the world. By 2000, the East Asian female childbearing population peaked and likewise entered a secular decline. Over the next decade, this decline in births beginning three decades ago, will severely impact the size of the childbearing female population. 20 to 40 year old females capable of childbirth in East Asia will decline by 40 million persons or -17% over the next ten years. This collapse in those capable of childbearing coupled with ongoing declines in fertility rates (those willing to undertake childbearing) has the potential for much larger declines in births than the UN is currently projecting...and I offer a more likely quantity of births. I'm suggesting that, by 2040, annual births in East Asia will be down something like 70% from the 1989 peak. All the debt, excess capacity, bridges to nowhere, speculative unoccupied housing, etc. will likely be more than this region can bear.
 1950-1989
 +132 million, +135% females...Annual Births +12 million, +53%
1989-2000 +28 million, +12%...Annual Births -11 million, -32%
2000-2020 -31 million, -12%...Annual Births -5 million, -22%
2020-2030 -39 million, -17%..Annual Births -2 million, -11% (-5 million, -26%)
2030-2040 -11 million, -6%...Annual Births -1 million, -5% (-2.5 million, -18%)
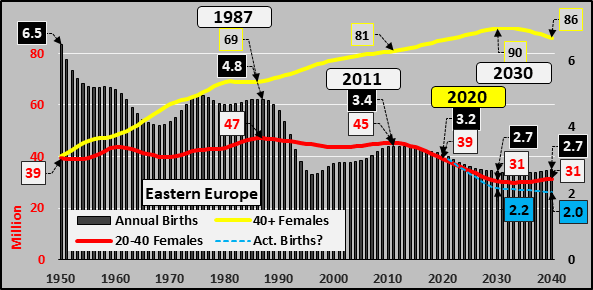
Eastern Europe Childbearing Females, Annual Births
(Russia, Belarus, Bulgaria, Ukraine, Czechia, Hungary, Poland, Moldova, Romania, Slovakia)
Like East Asia, the Eastern European childbearing population is in the midst of an unavoidable freefall. Those females capable of childbirth will decline by 8.5 million or a 22% decline. Like East Asia, the collapse of those capable and ongoing collapse in those willing (fertility rate) will lead to significantly lower births than the UN is projecting. By 2040, annual births in Eastern European births are likely to be down 70%+.
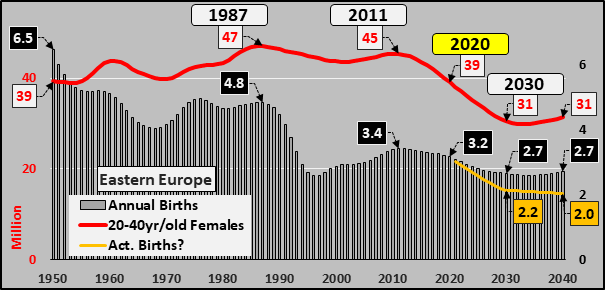 1950-1987
 +8 million, +20% females...Annual Births -1.6 million, -25%
1987-2011 -1.8 million, -4%...Annual Births -1.4, -29%
2011-2020 -6 million, -14%...Annual Births -250k, -7.5%
2020-2030 -8.5 million, -22%...Annual Births -510, -16% (-1 million, -30%)
2030-2040 +800k, +2.6%...Annual Births +50k, +2.6% (-100k, -3.4%)
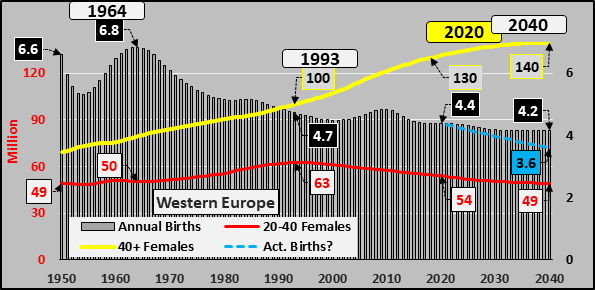
Western Europe Childbearing Females, Annual Births
Like East Asia and Eastern Europe, the childbearing females are in decline but the decline will be significantly gentler if high rates of immigration continue. Assuming ongoing immigration, the fall in births may likewise not be as stupendous. Because of immigration, Western European births are likely to be down "only" 50% from the '64 peak.
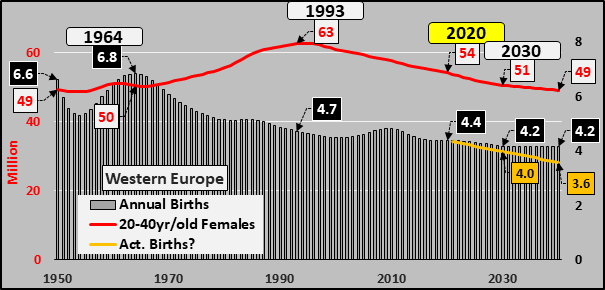 1964-1993
 +12 million, +20% Females…Annual Births -2.1 million, -31%
1993-2020 -8.5 million, -14% Females...Annual Births -330k, -7%
2020-2030 -3.6 million, -7% Females...Annual Births -210k, -5% (-420k, -10%)
2030-2040 -1.4 million, -3% Females...Annual Births -0, -0% (-380k, -10%)
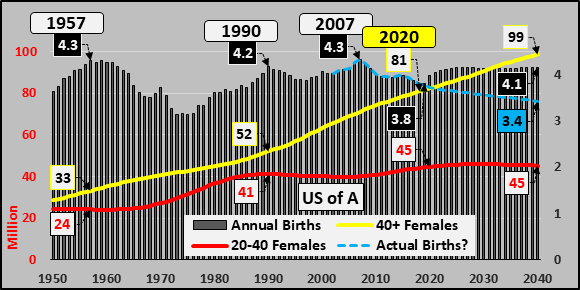
US Childbearing Females, Annual Births
US births essentially peaked in 1957 and only in one year thereafter (2007) did the US ever have more children than in 1957. The US childbearing population of females rose rapidly from 1970 to 1990 but has been little changed ever since. The ongoing declining US fertility rate has been overwhelming the relatively minor growth in the childbearing female population, resulting in fast falling total births since 2007. Most / all of the anticipated growth in the US childbearing female population is anticipated to come from immigration, but primarily due to stricter border enforcement, US immigration is at low levels not seen for decades. The impact will be little to no growth in the childbearing population coupled with deeply negative fertility rates, resulting in ongoing falling total US births. Based on this, annual US births are likely to be down over 20% by 2040 instead of the Census and UN estimates of rising births.
By the way, 10 US states are now outright depopulating (and this number will keep growing) and likely over half of the states have declining under 65 year old populations only disguised by even faster growing 65+ year old populations. As for counties, likely 60% to 80% of counties have declining under 65 year old populations. While major metropolitan centers continue growing, it is primarily at the expense of rural American emigration.
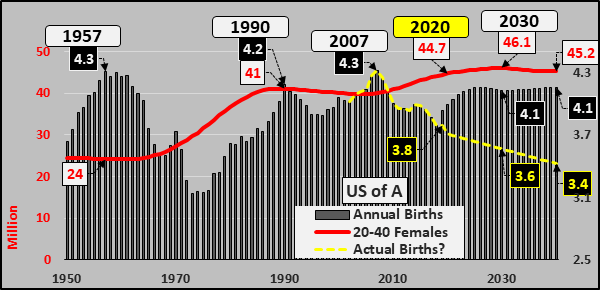 1957-1990
 +17 million, +70% females...Annual Births -100k, -3%
1990-2007 -1 million, -2% females...Annual Births +140k, +3%
2007-2020 +4.7 million, +12% females...Annual Births -600k, -14%
2020-2030 +1.3 million, +3% females...Annual Births -400k, -11%
2030-2040 -1 million, -2% females...Annual Births -700k, -20%
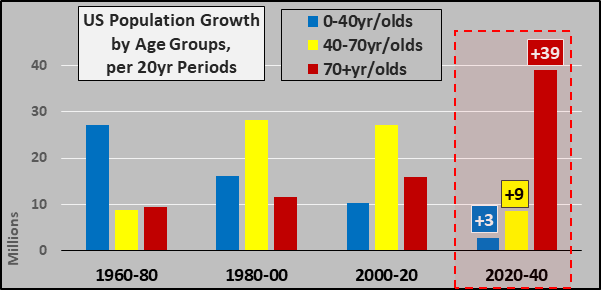
As for the most optimistic of population growth scenarios, the chart below details the shifting population growth (as per UN #'s) per twenty year periods from among the young to almost solely among the elderly...with all the associated problems. Actual births and under 40 year old population growth will turn to outright decline if my birth projection and/or ongoing tanking immigration continue.
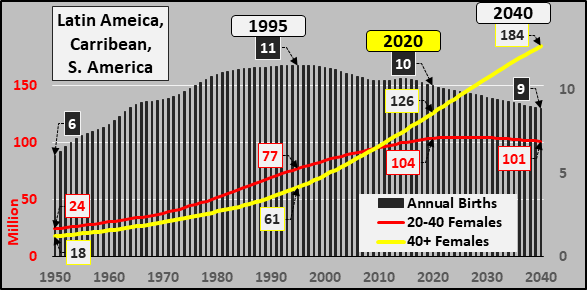
 Latin America / Caribbean / South America
(Everything Western Hemisphere except US/Canada)
Latin America / Caribbean / South America
(Everything Western Hemisphere except US/Canada)
Annual births across Latin America peaked in 1995 and have been gently receding ever since. The outcome of these declining births and net emigration is a childbearing population that will begin declining by the mid 2020's. From there, births will begin declining faster. Annual births will only continue downward and likely far more than the UN's projection of a 27% decline by 2040. How far? Your guess is probably as good as mine.
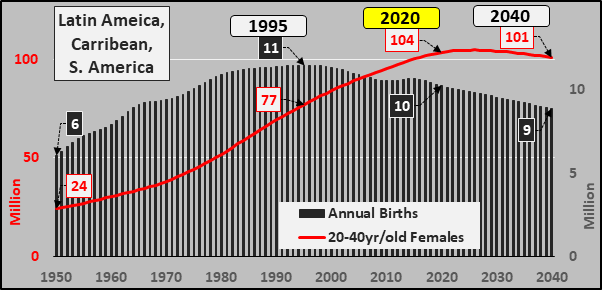 1950-1995
 +52 million females, +216%...Annual Births +5.4 million, +89%
1995-2020 +27 million females, +35%...Annual Births -1.2 million, -11%
2020-2030 +0.6 million females, +1%..Annual Births -0.7 million, -7%
2030-2040 -3.3 million females, -3%...Annual Births -0.7 million, -7%
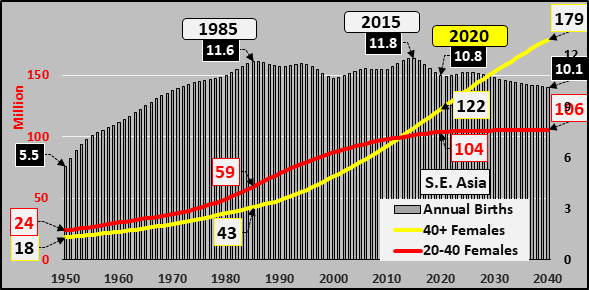
South East Asia Childbearing Females, Annual Births
(Cambodia, Brunei, Indonesia, Lao, Malaysia, Myanmar, Philippines, Singapore, Thailand, Vietnam)
This region also had a double peak in annual births, 1985 and just slightly higher in 2015. A flat childbearing population coupled with mostly negative fertility rates among these nations will result in ongoing declining annual births, according to the UN, down something like 14% by 2040.
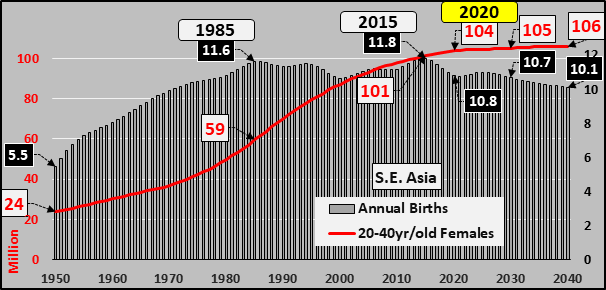 1950-1985
 +36 million, +149% females…Annual Births +6 million, +113%
1985-2015 +42 million, +70% females…Annual Births +200k, +2%
2015-2030 +3.9 million, +4% females...Annual Births -1.1, -10%
2030-2040 +0.5 million, +1% females…Annual Births -0.5 million, -5%
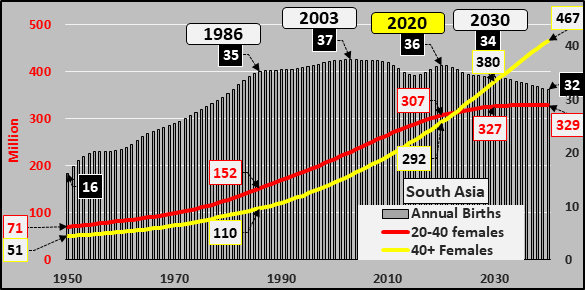
South Asia Childbearing Females, Annual Births
(India, Pakistan, Afghanistan, Bangladesh, Iran, Bhutan/Nepal, Sri Lanka)
The worlds most populous region saw fast rising annual births from 1950 until 1986, more than doubling annual births over that period. However, since 1986, annual births have essentially been unchanged and peak births occurred somewhere around 2003. This means the growth of the childbearing population is nearly over and with fertility rates now nearly down to 2.1 and ongoing net emigration, the UN projects annual births will be down 14% from peak births by 2040.
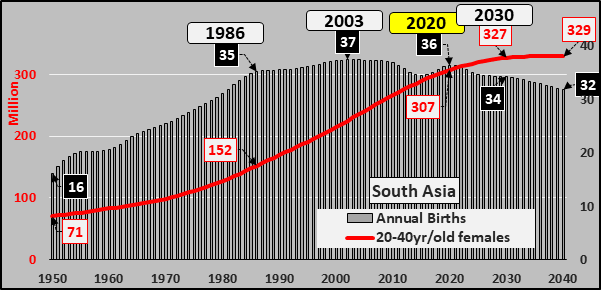 1950-1986
 +81 million females, +115%...Annual Births +19 million, +117%
1986-2020 +156 million females, +103%...Annual Births +1.2 million, +3%
2020-2030 +19 million females, +6%...Annual Births -2.2 million, -6%
2030-2040 +2.5 million females, +1%...Annual Births -2.4 million, -7%
Extra Credit-
The following countries are unlikely to survive within their current monetary, political, and geographical locations as the populations collapse against skyrocketing debt, surging overcapacity, and collapsing domestic and international import demand.
China 20 to 40yr/old females, Annual Births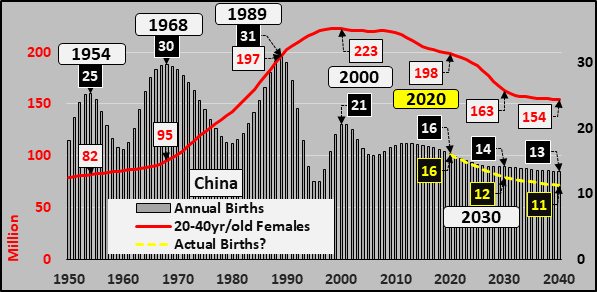
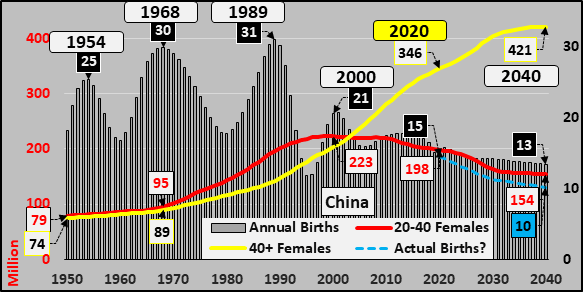
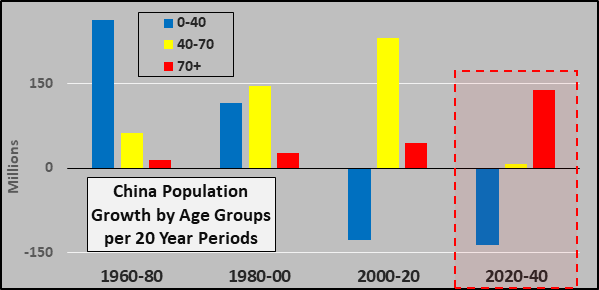
As of 2019, Chinese births have fallen 48% since the 1989 peak and childbearing females have declined 11% since the 2000 peak. By 2040, females will be down 31% and births down between 55% to 65%.
Below, the big picture in China. The next twenty years will be a collapse in domestic demand for everything except adult diapers as the under 40 year old population falls 140 million (this is using UN #'s, not my lower and more realistic #'s) and the 70+ segment rises by the same 140 million.
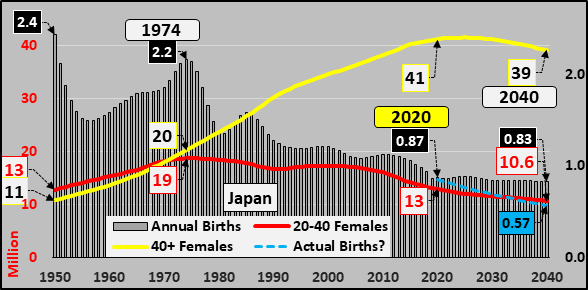
 Japan 20 to 40yr/old females, Annual Births
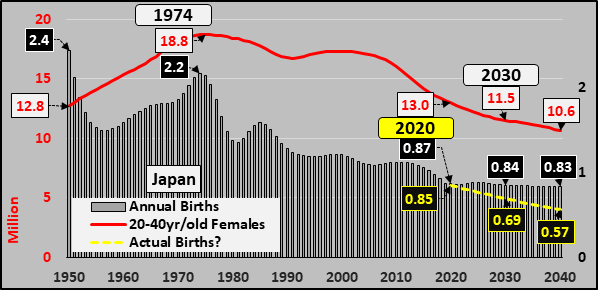
As of 2019, Japanese births have fallen 64% and childbearing females down 31%...by 2040 childbearing females will fall by 43% and births will be down between 66% to 77%.
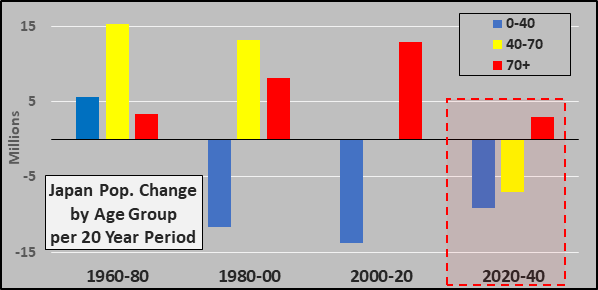
Detailed below is that the next twenty years will be the end of population growth for any age segment in Japan. After 2040, all population segments will be pointing downward as Japan's population collapses (again, this is using UN #'s, not mine).
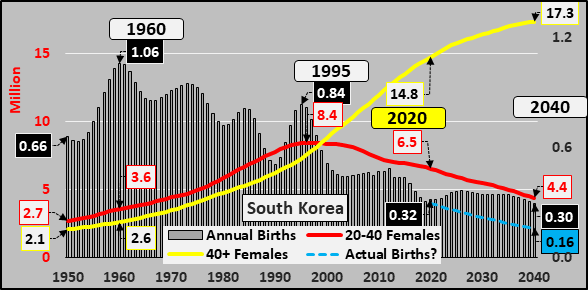
 South Korea 20 to 40yr/old females, Annual Births
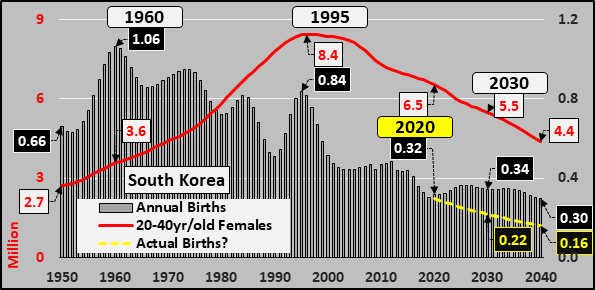
As of 2019, South Korean births have declined 71% from the 1960 peak...the childbearing female population has declined 23%. By 2040, childbearing females will be down nearly 50% and annual births will be down more than the UN's 72% projection; more likely 85% or more.
The full picture in South Korea, the chart below details the changing nature of the Korean population. Over the next twenty years, the young and working age populations will sink (again, using UN #'s) while the number of elderly soar. The actual #'s will be significantly lower as more realistic births become evident but the elderly population growth will remain unchanged.
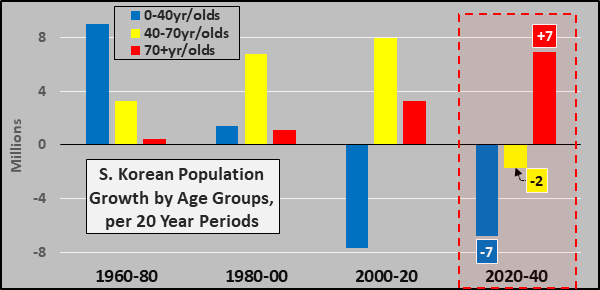
This is not viable in South Korea, Japan, or China, among so many others and typically when something cannot be, it will not be. I suspect "something" will likely intercede before too long that radically changes the picture.

 As a quick aside, here's a visual representation of inversely correlated Federal Funds rate (black dash), federal government marketable debt (red), and Federal Reserve balance sheet (yellow) vs the 25- to 54-year-old population (blue) and those employed (green) among them.
 25- to 54-year-old employment to population ratio (white line) set against the Federal Funds rate (black dash), marketable federal debt (red), and Federal Reserve balance sheet (yellow). Ever since females were fully incorporated into the workforce (1990), the full-employment ceiling of potentially employed persons among the population has been around 81%. Once 81%'ish is reached, no fuel for further employment (or economic) growth remains, terminal federal funds rate is hit, and interest rate cuts and debt-fueled deficit spending ramps.
 Year over year change in 25- to 54-year-old population (red line) vs. year over year change in 25- to 54-year-old employees (blue columns), and population to employment ratio (white line). Deficit fueled demand creates deficit induced full employment until there is no further potential growth available...and then recession, interest rate cuts, deficit spending...wash, rinse, repeat (at ever greater cost and ever decelerating relative GDP growth).
 25- to 64-year-old population, 25- to 64-year-old employees, total housing units.
 15- to 74-year-old population, 15- to 74-year-old employees, total housing units.
 16+ year-old population, 16+ year-old employees, total housing units.
  Full time employee's vs total housing units. To be mortgage worthy, typically steady income from a full-time job is paramount. Housing unit growth is significantly outpacing full time employee growth...particularly concerning as we're at historical "full employment".
 Total US population, total housing units, and housing units per capita...well above the previous record set in 2008...and likely moving higher with record housing units under construction.
 Regarding the narrative of more households being occupied by persons living alone, structurally driving housing demand higher. I'd direct these folks to the Census data, which shows a flat to rising number of adults per household since the turn of the century...and all of the declining occupants per household are dramatically fewer children...not more adults living separately requiring a shift in higher housing units per capita!?!
 Regarding that record housing units under construction (dk blue line) and lower single-family housing under construction (aqua line), typically when new houses sold (white line) peaks and begins to tank, under construction follows. However, during this cycle tanking purchases have been met w/ accelerating supply. Curious...these types of mismatches are often seen amid bubbles!?!
 This extremely high housing units under construction vs falling new houses sold has left us with the greatest quantity of under construction minus new houses sold monthly in US history (lt blue line)...